On July 8, 2022 has been released a new version of GCDkit 6.1. It was developed in R 4.1.3 and code-named, in support of a struggle for democracy and freedom, Invincible tractor. There are no revolutionary changes, but rather bug fixes and performance improvements. The main aim was to optimize the whole system for speed. Most important features are summarised below.
- Quicker start up with several options.
- Normative calculations have been further optimized for speed.
- Quicker routine enabling overplotting datasets.
- Many functions can be newly called in the batch mode: e.g., addLegend(), cluster(), mergeDataRows(), mergeDataCols().
- trendTicks() was modified, so that it can be used also in cases when only [x,y] coordinate pairs along the trend are known. In this case, a fourth-order polynomial is fitted to the data. Also, the function trendTicks() can be called just to perform the underlaying calculations, returning all the parameters of the fitted trend invisibly (plot = FALSE).
- Optional offline installation, if no live Internet connection is available.
- Several parameters of a plate can be changed at the same time, using the brand new function plateUser(). It is simply a wrapper to the modified function figUser, invoked to modify each individual slot.
- New function diagramWithCircles() - the same like plotWithCircles() but plotting a diagram (stand-alone Figaro template) on the background.
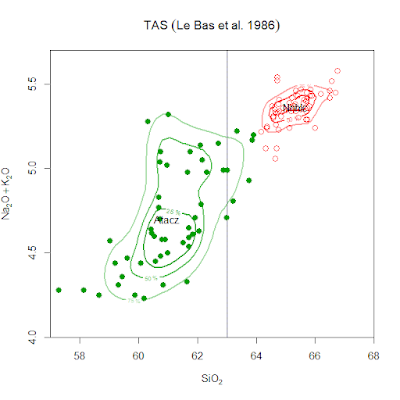
- New functions contourAll, chullAll outlining the whole dataset (analogous to the already existing contourGroups, chullGroups).
- contourAll, contourGroups use now much improved algorithm; contouring is based on kernel density estimates.
- Reprogrammed were many of the functions in the SrNd.r plugin.
- Error bars plotting (obtained by the function fousy()) were improved significantly.
Bug fixes
- profiler()redesigned completely, updated were especially colour handling and legends; this function can work also with a variable different from WR.
- EarthChem() thoroughly checked/tested, including documentation and examples. It was redirected to http://portal.earthchem.org/restsearchservice.
- Spiderplots and profiles did not zoom up correctly.
- CIPW() was slow, and its repeated use further slowed down the whole system (thanks to Sergio Esteve for suggesting a remedy for this problem). Analogous issue has been fixed also in CIPWhb() and Catanorm() normative calculations.
- isocon() function did not return results, both slopes were swapped in the output and the examples with atomic=TRUE did not work correctly.
- plateLabelSlots() fixed, was causing unpredictable behaviour when followed by overplotDataset, plateAddReservoirs etc.
- Patches were not loaded due to namespace conflicts. The whole patching code was revised.
- Some functions of GCDkit did not work correctly in RStudio under Windows.
- Whalen() did not plot some of the average A-type compositions correctly.
- Manual pages for some of the geotectonic diagrams were not linked to the HTML help system.
- Many doi links were added/updated/fixed in the help system.
- figMulti() did not produce correctly all spiderplots if one or more groups were empty (e.g., when lacking the REE data).
- User-defined Ta/Yb - K2O/Yb (Pearce 1982) plot [PearceDestructive1.r] fixed.
- HTML output is newly produced in temporary directory, where a writing permission should be always guaranteed.
- plotWithCircles(): sizing of smallest circles improved, the colours can be newly semitransparent.
- After invoking peekDataset(), lists of available classification and geotectonic plots are built afresh to match the data available in the given dataset.
- Frost(), Frost_2008(), Maniar(), Cann(), Whalen() and MullerKternary() functions did not allow overplotting on some of their panels.
- [Win] r2clipboard() did not work on Windows systems.
- [Win] save.data() was appending to preexisting files instead of overwriting them.
- [Mac] HTML web system was malfunctioning in the Safari browser on Mac.
- [Mac] Rudimentary functionality for the Plate() function, instead of an error message.
New geotectonic/general purpose diagrams
- Plotting scatterplot with smoothed densities (smoothed two-dimensional histogram) after Eilers & Goeman (2004) (courtesy of Paul Eilers).
- New binary geotectonic diagram ThN-NbN for basaltic rocks of Saccani (2015) based on NMORB-normalized compositions.
- New CIPW-normative classification diagram for plutonic rocks of Enrique (2018).


