Saturday, 9 November 2024

An R software for recalculations and plotting of mineral analyses (GCDkit.Mineral) has been unleashed!

In September issue of American Mineralogist appeared our paper describing GCDkit.Mineral, a freeware for recalculation, plotting, and statistical treatment of mineral data obtained by microbeam techniques, typically an electron microprobe (EPMA). Much of the following text comes from its abstract. 

The GCDkit.Mineral is fully platform-independent, and thus running on all the main operation systems (Windows/Mac/Linux). It shares much of its core with the standard GCDkit, including the same look and feel of its graphical user interface.  Hence the program imports compositional data in various commonly used file formats (Plain ASCII text (*data), CSV, MS Excel XLS(X), MS Access (MDB), or DBF files) or retrieves them from the clipboard. 

After loading, the dataset is split using the information given in the column 'Mineral'. The input EPMA data (in wt. %) are recalculated to atoms per formula unit (apfu) based on a required number of O equivalents, atoms, or charges, with or without FeII/FeIII estimation by various methods (Droop's method assuming a certain sum of cations in the entire formula or just a single crystallographic site, specific methods for amphiboles and pyroxenes). 

Analyses may then be recast to structural formulae, i.e., the atoms are distributed into appropriate sites. For minerals forming solid solutions, the molar percentages of end-members are computed, as can be some extra parameters. 

All the data may be treated statistically, either by built-in functions for descriptive and multivariate statistics (e.g., PCA and LDA) or using the wealth of tools provided by the wide R community.

Using the standard GCDkit philosophy, raw and recalculated mineral data may be plotted on binary and ternary plots, profiles, and boxplots. Most are defined as internal templates that provide a means to make later changes to the plot (zooming and scaling, adding comments or legend, identifying data points, altering the size or colour of the plotting symbols, etc.). The publication-ready graphics may be saved into several vector-(PostScript, PDF, and WMF) and bitmap-based (e.g., PNG, TIF, and JPG) formats, ready to be imported into a professional graphical, presentation, or desktop publishing software.

The graphical templates are used as a basis for classification. The general classification routine looks for the name of the polygon within the diagram (= graphical template), into which the analysis falls according to its x-y coordinates. The outcome may be either the name of a mineral or a link to another diagram in the case of more complex classification schemes. Following the rules of the International Mineralogical Association (IMA), in some cases, the classification is not done graphically but using prescribed algorithms. 

The GCDkit.Mineral is fully menu-driven and contains embedded default recalculation options for many common rock-forming minerals. More experienced users may easily tweak these parameters, as they are saved in a logically structured plain text file. Seasoned R programmers may invoke GCDkit.Mineral in command line mode, use batch scripts or Python-driven notebooks (e.g., of project Jupyter), or modify and develop new recalculations or plugins.

The current version, however, cannot deal with elements with multiple valencies (apart from FeII/FeIII) and separate H2O determinations are not taken into account. The choice of IMA classification schemes remains restricted (only Fsp, Amp, Cpx, Opx). Future version shall import trace-element determinations, obtained e.g. by LA-ICP-MS or ion probe, and will contain means for their interpretation (e.g. spiderplots).

Interested? You can download the current version from http://mineral.gcdkit.org.

Reference
Janoušek, V., Farrow, C. M., & Erban, V. GCDkit.Mineral – a customizable, platform-independent R-language environment for recalculation, plotting and classification of electron-probe micro-analyses of common rock-forming minerals. American Mineralogist 109 (9): 1598–1607.  https://doi.org/10.2138/am-2023-9032

Wednesday, 10 August 2022

GCDkit 6.1 has been released!

On July 8, 2022 has been released a new version of GCDkit 6.1. It was developed in R 4.1.3 and code-named, in support of a struggle for democracy and freedom, Invincible tractor. There are no revolutionary changes, but rather bug fixes and performance improvements. The main aim was to optimize the whole system for speed. Most important features are summarised below.


Performance improvements
  • Quicker start up with several options.
  • Normative calculations have been further optimized for speed. 
  • Quicker routine enabling overplotting datasets.
  • Many functions can be newly called in the batch mode: e.g., addLegend(), cluster()mergeDataRows(), mergeDataCols().
  • trendTicks() was modified, so that it can be used also in cases  when only [x,y] coordinate pairs along the trend are known. In this case, a fourth-order polynomial  is fitted to the data.  Also, the function trendTicks() can be called just to perform the underlaying calculations, returning all the parameters of the fitted trend invisibly (plot = FALSE).
  • Optional offline installation, if no live Internet connection is available.  
  • Several parameters of a plate can be changed at the same time, using the brand new function plateUser(). It is simply a wrapper to the modified function figUser, invoked to modify each individual slot.
  • New function diagramWithCircles() - the same like plotWithCircles() but plotting a diagram (stand-alone Figaro template) on the background.
  • New functions contourAll, chullAll outlining the whole dataset  (analogous to the already existing contourGroups, chullGroups).
  • contourAll, contourGroups use now much improved algorithm; contouring is based on kernel density estimates.
  • Reprogrammed were many of the functions in the SrNd.r plugin.
  • Error bars plotting (obtained by the function fousy()) were improved significantly.
Bug fixes
  • profiler()redesigned completely, updated were especially colour handling and legends;  this function can work also with a variable different from WR.
  • EarthChem() thoroughly checked/tested, including documentation and examples. It was redirected to http://portal.earthchem.org/restsearchservice.
  • Spiderplots and profiles did not zoom up correctly.
  • CIPW() was slow, and its repeated use further slowed down the whole system (thanks to Sergio Esteve for suggesting a remedy for this problem). Analogous issue has been fixed also in CIPWhb() and Catanorm() normative calculations.
  • isocon() function did not return results, both slopes were swapped in the output and the examples with atomic=TRUE did not work correctly.
  • plateLabelSlots() fixed, was causing unpredictable behaviour when followed by overplotDatasetplateAddReservoirs etc.
  • Patches were not loaded due to namespace conflicts. The whole patching code was revised.
  • Some functions of GCDkit did not work correctly in RStudio under Windows.
  • Whalen() did not plot some of the average A-type compositions correctly.
  • Manual pages for some of the geotectonic diagrams were not linked to the HTML help system.
  • Many doi links were added/updated/fixed in the help system.
  • figMulti() did not produce correctly all spiderplots if one or more groups were empty (e.g., when lacking the REE data).
  • User-defined Ta/Yb - K2O/Yb (Pearce 1982) plot [PearceDestructive1.r] fixed.
  • HTML output is newly produced in temporary directory, where a writing permission should be always guaranteed.
  • plotWithCircles(): sizing of smallest circles improved, the colours can be newly semitransparent.
  • After invoking peekDataset(), lists of available classification and geotectonic plots are built afresh to match the data available in the given dataset.
  • Frost(), Frost_2008(), Maniar(), Cann(), Whalen() and MullerKternary() functions did not allow overplotting on some of their panels.
  • [Win] r2clipboard() did not work on Windows systems.
  • [Win]  save.data() was appending to preexisting files instead of overwriting them.
  • [Mac]  HTML web system was malfunctioning in the Safari browser on Mac.
  • [Mac] Rudimentary functionality for the Plate() function, instead of an error message.
New geotectonic/general purpose diagrams
  • Plotting scatterplot with smoothed densities (smoothed two-dimensional histogram) after Eilers & Goeman (2004)  (courtesy of Paul Eilers).
  • New binary geotectonic diagram ThN-NbN for basaltic rocks of Saccani (2015) based on NMORB-normalized compositions.
  • New CIPW-normative classification diagram for plutonic rocks of Enrique (2018).


Friday, 19 June 2020

Known GCDkit 6.0 installation problems and how to solve them

We have been  receiving reports recently of failed installations on both Mac and Windows. If you have the same problem, please:

  • Check once more all the instructions at http://www.gcdkit.org/download
  • In particular, make sure that you install R first, in appropriate version (that is 3.6.0 for GCDkit  6.0)
  • If you are behind a proxy, select Internet2  option during Custom R installation
  • Check that you are online before installing the supporting libraries
On Windows:
  • For installation, run R with admin privileges
  • If you receive a message saying that RODBC is not available for R 3.6.0:
    [1] Download the zipped version of the RODBC library from https://cran.r-project.org/bin/windows/contrib/3.6/RODBC_1.3-16.zip.
    [2] Go to RGUI menu Packages>Install package(s) from local zip files... and browse for this downloaded file on your disc. DO NOT unzip it beforehand. 
  • In case you are missing any other R libraries, their appropriate zipped version can be found at  https://cran.r-project.org/bin/windows/contrib/3.6/, downloaded and installed analogously to the case of RODBC.
We do apologise for the inconvenience - the fact that  RODBC library is not correctly configured on the CRAN server is unfortunately beyond our control.

I am pleased to announce that we are just finishing a GCDkit version 6.1 that should fix a few known bugs and feature, among other things, also offline installer.

Vojtech 

Thursday, 22 August 2019

GCDkit 6.0 has been unleashed. What is new?

On August 16, 2019 has been released a new version of GCDkit 6.0. It was developed in R 3.6.0 and code-named Il padrino sono io. This is the first truly platform independent version that could run on all systems, including Mac OS X and Linux from both command line and graphical user interface (GUI). The most important changes are summarised below.

Platform-independent GUI
  • Optional platform-independent Tcl/Tk graphical user interface (GUI)
  • In both command-line/batch mode and from graphical user interface (GUI), the GCDkit should run also operation systems other than Windows, notably Linux or Mac OSX. To start GUI on non-Windows systems, type menuet()

Performance improvements
  • Quicker response of the menu for geotectonic plots that is newly being built only once, upon the system startup 
  • Quicker and improved routine enabling overplotting datasets, especially values after Debon and Le Fort.
  • Some norms (most notably CIPW) were speeded up considerably.


User-defined plots

  •  Help pages to user-defined plots are added automatically to the html help system.
Bug fixes
  • Correct function on the Chinese (and perhaps other non-European) locales.
New plugins
  • New plugin for ternary projection from biotite (Moyen et al. 2017).
New geotectonic/general purpose diagrams
  • B vs. Mg/(Fe + Mg), Q vs. B, K/(Na+K) vs. B and BQF ternary diagram of Debon and Le Fort (1983, 1988) 
  • Diagrams for classification of feldspathic igneous rocks of Frost and Frost (2008)
  • Diagram of Laurent et al. (2014) to decipher possible source of granitic magmas
  • New function phasePropPlot() that plots barplot of mineral proportions
  • Mesonormative Q'-ANOR diagram of Streckeisen and Le Maitre (1976) was added to the Classification plots and can be indeed used for this purpose now. If necessary, a matrix of mesonormative values can be provided upon call; otherwise these are to be calculated anew. 

The new version of GCDkit has been unveiled at the Goldschmidt Conference in Barcelona on 21 August. Follow this link for the PDF version of the poster. 

Sunday, 3 March 2019

GCDkit not starting on Chinese locales?

Several users from China have reported problems with running GCDkit 5.0.

The troublemaker is the newly introduced Eartchem module, as already mentioned here: http://blog.gcdkit.org/2018/04/version-50-has-been-just-released.html#comments 

The problem is clearly with multibyte encoding of Chinese characters. But the bug may be also affecting the users on other locales/systems, including Mac.

The fix is relatively simple, though. Please, in the line 216 of the EarthChemFUN.r file, replace the text by:

if(.Platform$OS.type=="windows") zzz[zzz==intToUtf8(0x00c2)]<-NA

and restart GCDkit.

Please accept my apologies. The next version of GCDkit (6.0), now at the stage of beta testing, will have this problem solved.

Vojtech

PS
Special thanks go to Jiacheng Tian and Shi-Chao Li for their helpful bug reports and patience.


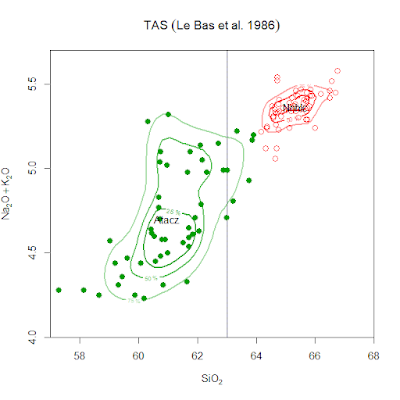
Plotting TAS diagram of Le Bas et al. (1986)

By far the most common bug report that we are getting concerns the implementation of the total alkali-silica (TAS) diagram of Le Bas et al. (1986) in GCDkit. But in reality, it is  not a bug, but a feature. One should be aware of the fact that the analyses plotted have been recalculated on 100% anhydrous (volatile-free) basis.  This is in accordance with the recommendation of the IUGS  Subcommission on the Systematics of Igneous Rocks (Le Bas et al. 1986; Le Maitre ed. 2002).

On the other hand, such a recalculation is not carried out for subsequent modifications of the TAS diagram (Cox et al. 2002; Middlemost 1994), where rough data are plotted.

In any case, using analyses with too high volatile contents is to be avoided, as they are suspicious from being affected by alteration and attendant mobility of alkalis.   


Cox KG, Bell JD & Pankhurst (1979) The Interpretation of Igneous Rocks.
Allen & Unwin, London

Le Bas MJ, Le Maitre RW, Streckeisen A & Zanettin B (1986)
A chemical classification of volcanic rocks based on the total alkali-silica
diagram. J Petrology 27: 745-750

Le Maitre RW (ed) (2002) Igneous rocks: a classification and glossary of terms: recommendations
of the International Union of Geological Sciences, Subcommission on the Systematics of
Igneous Rocks, 2nd edition. Cambridge University Press


Middlemost EAK (1994) Naming materials in the magma/igneous rock system.
Earth Sci Rev 37: 215-224

Wednesday, 18 April 2018

How to use GCDkit in a batch mode II


In one of the earlier blogs, Jeff has presented my exercise showing effective use of batch mode borrowed from our joint workshop at University of Catania.  

Here I would like to carry on and show the new capabilities of GCDkit to use multiple datasets and to overplot them on a single diagram (or plate thereof).

Binary plot

# Loading and storing the 1st dataset
data(atacazo)
accessVar("atacazo")
assign1col("gray")
pokeDataset("atacazo",overwrite.warn=FALSE)

Loading and storing the 2nd dataset
data(sazava)
accessVar("sazava")

Switching back to the atacazo dataset
peekDataset("atacazo")
# Overplotting classification diagram
plotDiagram("TAS",F,F)
overplotDataset("sazava",pch="*",col="red",cex=2)

Spiderplot

# Overplotting on spiderplot
peekDataset("atacazo")

# Atacazo as grey field
spider(WR,"Boynton",0.1,1000,field=TRUE,fill.col=TRUE,
  shaded.col="khaki")
overplotDataset("sazava")


A plate (Harker plots)

# blatna dataset
data(blatna)
accessVar("blatna")
multiple("SiO2","MgO,CaO,Na2O,K2O")
plateXLim(c(53,70)) # Common x axis scaling
plate0YLim() # All y axes start from 0

plateCex(1.5)
plateCexLab(1.5)
plateCol("gray")

# Overplot sazava on top of it
overplotDataset("sazava",cex=2)


# Getting rid of the datasets other than the current (blatna)
purgeDatasets()